Real-time dashboards
Key metrics appear automatically without manual compiling.
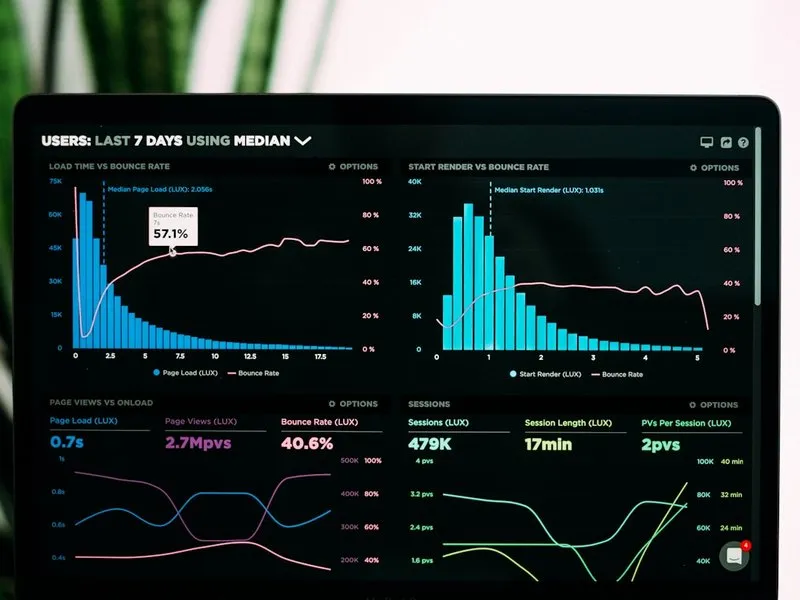
All operational metrics in one real-time dashboard — from the field to the boardroom. Including thematic maps and media analytics for government agencies.
 Real-timeAutomated ETLGIS
Key metrics appear automatically without manual compiling.
Data from multiple sources is cleaned and merged on a schedule.
Data is shown on thematic maps to read the regional context.
Tracking issues and sentiment across media and social media.
Summaries sent automatically to leadership.
Everyone sees the data within their authority.
Application databases, spreadsheets, IoT devices, CCTV, and public sources — we map them at the start of the project.
Yes. Dashboards are responsive and access is set per role.
Yes. We build thematic map portals and geospatial dashboards for government agencies.
Tell us about your Data & Analytics needs. The first discussion is free.